因為工作關係,所以公司指派我找了一個套件,公司要我摸圖表的部分,我就稍微找一下台灣南部區域的溫度表來寫個小範例嚕
<!DOCTYPE html>
<html>
<head>
<meta http-equiv="Content-Type" content="text/html; charset=utf-8">
<link href="http://ajax.googleapis.com/ajax/libs/jqueryui/1.8/themes/base/jquery-ui.css" rel="stylesheet" type="text/css"/>
<script src="http://ajax.googleapis.com/ajax/libs/jquery/1.4/jquery.min.js"></script>
<script src="http://code.highcharts.com/highcharts.js"></script>
<script type="text/javascript">
$(function () {
var chart;
$(document).ready(function() {
chart = new Highcharts.Chart({
chart: {
//取得div容器的id
renderTo: 'test',
zoomType: 'xy',
//折線圖
type: 'line',
//右方間距
marginRight: 130,
//下方間距
marginBottom: 25
},
title: {
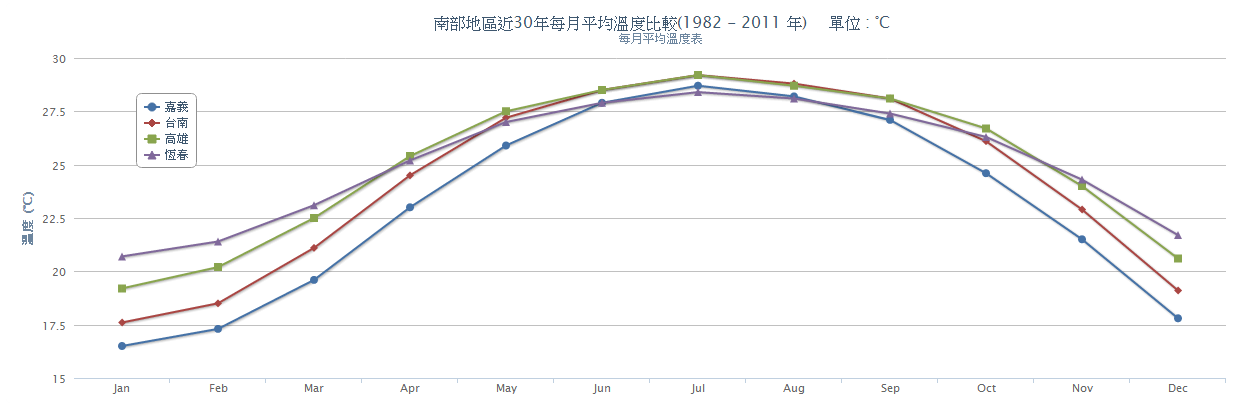
text: '南部地區近30年每月平均溫度比較(1982 - 2011 年)單位 : °C',
x: -20 //位置至中
},
subtitle: {
text: '每月平均溫度表',
x: -20
},
credits: {
//隱藏官方連結
enabled: false
},
xAxis: {
//x軸的座標點
categories: ['Jan', 'Feb', 'Mar', 'Apr', 'May', 'Jun', 'Jul', 'Aug', 'Sep', 'Oct', 'Nov', 'Dec']
},
yAxis: {
title: {
//Y軸表頭
text: '溫度 (°C)'
},
},
tooltip: {
formatter: function() {
return '<b>'+ this.series.name +'</b><br/>'+
this.x +': '+ this.y +'°C';
}
},
legend: {
//由上至下
layout: 'vertical',
//靠左
align: 'left',
//從左上方為起點(0, 0)距離
x: 120,
y: 80,
//靠上
verticalAlign: 'top',
floating: true,
//框內背景顏色
backgroundColor: '#FFFFFF'
},
series: [{
name: '嘉義',
data: [16.5, 17.3, 19.6, 23.0, 25.9, 27.9, 28.7, 28.2, 27.1, 24.6, 21.5, 17.8]
}, {
name: '台南',
data: [17.6, 18.5, 21.1, 24.5, 27.2, 28.5, 29.2, 28.8, 28.1, 26.1, 22.9, 19.1]
}, {
name: '高雄',
data: [19.2, 20.2, 22.5, 25.4, 27.5, 28.5, 29.2, 28.7, 28.1, 26.7, 24.0, 20.6]
}, {
name: '恆春',
data: [20.7, 21.4, 23.1, 25.2, 27.0, 27.9, 28.4, 28.1, 27.4, 26.3, 24.3, 21.7]
}]
});
});
});
</script>
<title>折線圖</title>
</head>
<body>
<div id="test"> </div>
</body>
</html>
畫面顯示如下:

 留言列表
留言列表